3 Experiment #1: comparison of decentralized and centralized search
With this experiment we would like to see how centralized similarity search and cycle search processes perform with comparison to decentralized processes. Preliminary design of the experiment is explained here.
3.1 Setup
For that purpose we have implemented Process #1 and Process #2 in centralized and decentralized flavours. In order to compare them we follow these steps:
- First, we create an Offer Network of predefined size (parameter
agentNumber); We experiment with the random graph (where agents are randomly connected withknowslinks) and a small-world graph, where we know the diameter of the network in advance; - Then we artificially create a list of items which, if correctly searched and connected in the OfferNet(s) graph, would form a chain. The length of the predefined chain is set by parameter
chainLength; - Items from the list are assigned to random agents in the network;
- Then, we create a special
taskAgentowning aworkwhich, when correctly connected to the potential chain inserted into the network by step 2, closes it into a loop forming a cycle (as shown in the figure 2.6). Finally, we run the decentralized and centralized processes on the same graph and log running times of each method.
5.1. Similarity search process connects all similar items with ‘similarity’ links, as explained here;
5.2. Cycle search process is run on behalf of taskAgent and discovers the cycle inserted by step 2 (in case similarity search process correctly connected similar items) – as explained here;
Note, that in decentralized case the all times of running the process on behalf of separate agents is aggregated.
An experiment is a series of simulations, each of which takes the following parameters:
agentNumber: number of agents in the network (apart fromtaskAgent);similarityConnectThreshold: the minimum similarity value between items connected with explicit link by similarity search process;chainLength: the length of the chain inserted into the network by step 2;similaritySearchThreshold: minimal similarity of items to be considered as eligible for exchange;maxDistance: radius of agent’s neighbour network when searching for similar items;randomWorksNumberMultiplier: the number of random works and items which are assigned to the agents in the network to make cycle search more realistic;
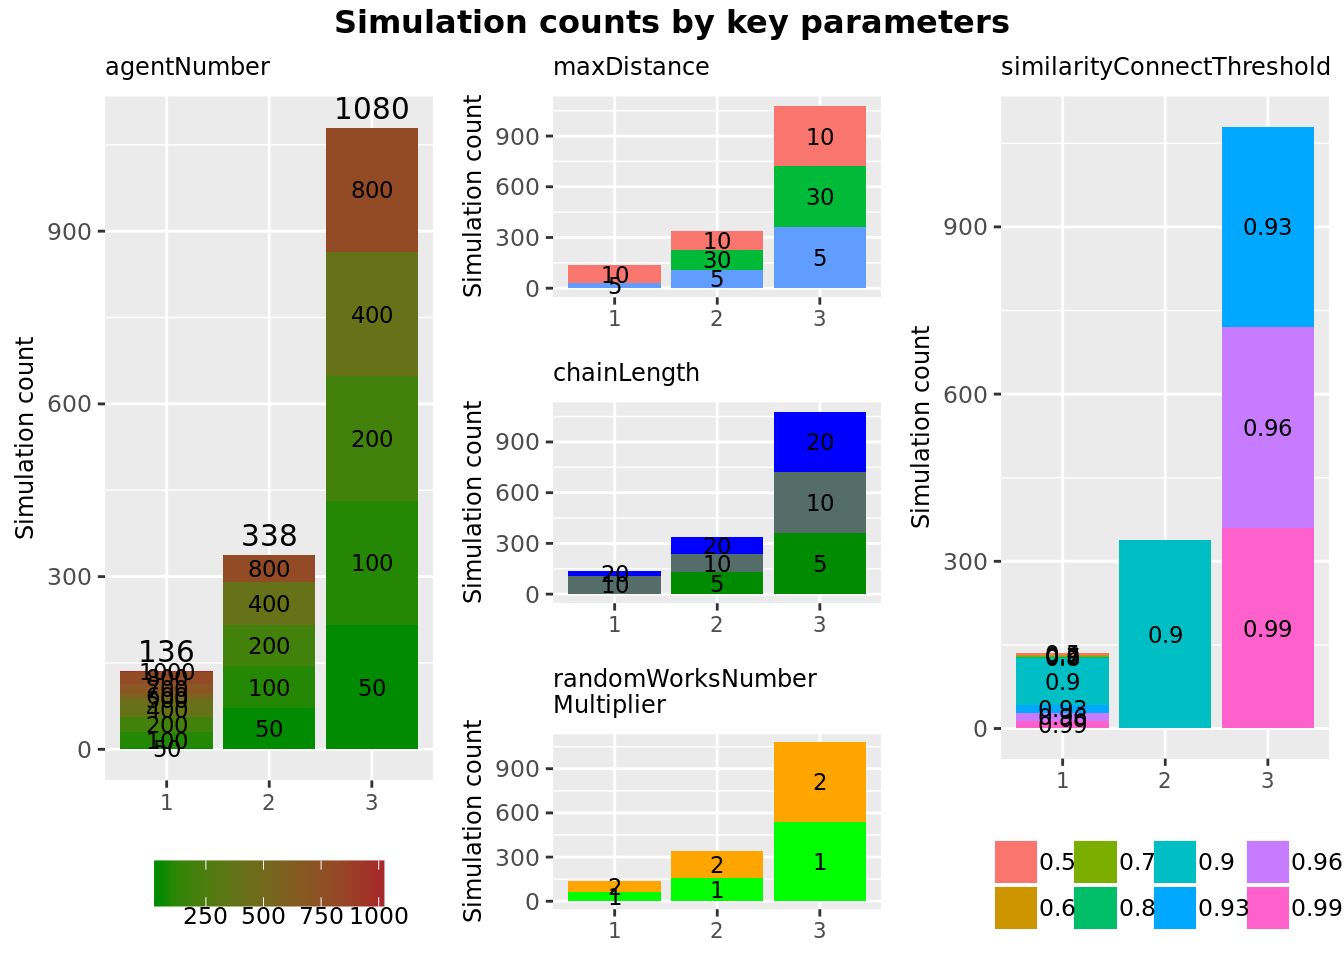
Figure 3.1: Distribution of simulation parameters of all analysed experiments ( 1554 simulations in total).
Detailed data about all experiments, simulations, their parameters and descriptive analysis of obtained results is provided in Electronic Laboratory Notebook here. In the next two sections we discuss insights of the analysis and further steps based on them.
3.2 Discussion
3.2.1 On decentralized versus centralized computation
As many non-trivial (and interesting) questions, the issue of whether centralized or decentralized models are “better” cannot be answered in a univocal manner. The short and not very informative answer to this question would be “it depends” – you can always find cases and examples where one of them works better. Our goal is therefore not to answer ‘yes or no’ but to figure out parameters and circumstances where one or another type of model or algorithm fairs better.
Notwithstanding what was said above, decentralized and centralized computation models are not equal in terms of their expressivity. It can be shown that centralized computation is a special case of the decentralized model. For this we have to establish a relation between non-determinism and decentralization. Recall first that any computation or a program can be expressed as a graph of atomic program steps (as nodes) and transitions between them (as links) (Turchin 1986; Pennachin, Goertzel, and Geisweiller 2014). In general any Turing machine can be represented as a graph (Laud 2011):
![Representing Turing machines as graphs (adapted from [@laud_complexity_2011]).](pictures/turing_machines_as_graphs.png)
Figure 3.2: Representing Turing machines as graphs (adapted from (Laud 2011)).
A centralized system is a system where all transitions between atomic program steps are known and controlled by a central observer – this corresponds to the figure on the left. In a decentralized system, every atomic program has a freedom to choose any possible transition and this choice cannot be a priori known or controlled in any manner by the central observer – this corresponds to the figure on the right. It is easy to see, that left image is the special case of right image, i.e. a non-deterministic / decentralized computation can be reduced to deterministic / centralized by pruning a number of links in the initial graph.
Bottom line, is that it makes sense to start designing a computational framework or architecture based on decentralized model but allow for a centralized computation to emerge out of it rather than the other way round. Even if emergence is not considered due high computational costs and overall unpredictability, it still makes sense to use decentralized framework and represent centralized processes ‘manually’.
3.2.2 Sensitivity to graph topology
One of the first hypotheses that experiments seem to support is that decentralized and centralized search have very different sensibility to the underlying graph topology. That is, centralized search algorithm is more sensitive to how many agent nodes are in the graph and not on how they are connected, while decentralized search is sensitive to the topology of \(agent \xrightarrow{\text{knows}} agent\) subgraph. This is because decentralized graph traversals continue only as deep as constrained by maxDistance parameters (which defines the radius of agent network to be searched – see setup) and if the diameter of graph is larger than this radius, then the cycle may not be found (even though it exists in a network). It is of course possible to increase maxDistance parameter to the arbitrary large number, but this also may increase time of search drastically (see graph below).
Figure 3.3: Dependence of simulation time on maxDistance parameter.
For confirming the sensitivity of algorithms to graph topology we also ran experiments with the same parameters on two different graph topologies – (1) randomly connected and (2) small world with diameter of less than 10. As shown in the diagram below, success rate of finding a cycle in a random graph is often lower than 100% (except when the depth of each traversal is made very large), while working on small world graph with a known diameter and corresponding maxDistance parameter guarantees that the cycle will be found if it exists in the graph even in a decentralized scenario.
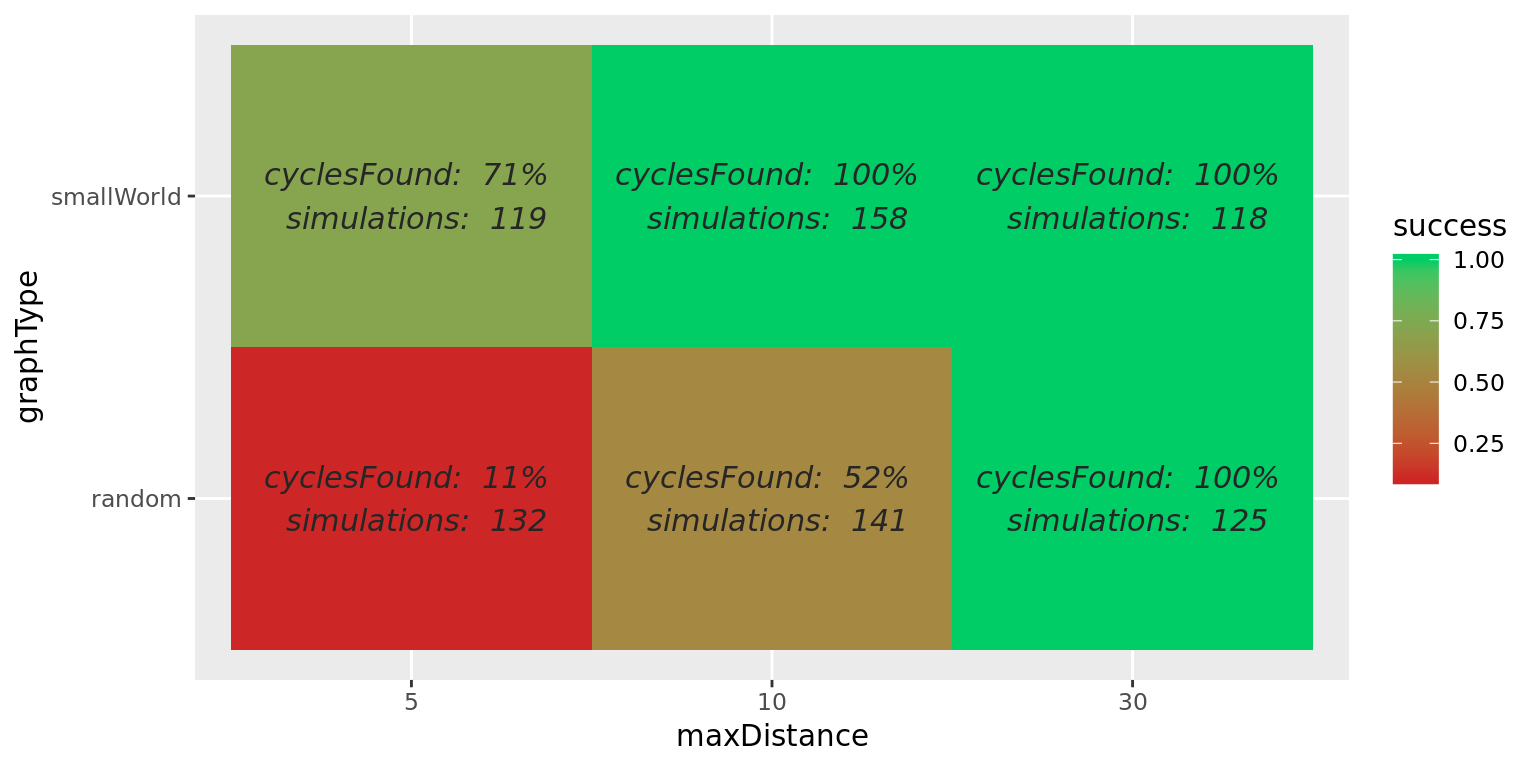
Figure 3.4: Success rate of finding a cycle in random and small world graphs, depending on maxDistance parameter. Small world graphs were with known diameter of =< 10. Note that with random graphs, maxDistance of 5 and 10 is not enough to traverse the whole graph, while 30 often provides (but does not guarantee!) full coverage. Similarly, maxDistance of 5 is not always enough to traverse small world graph which has larger diameter of around 10.
3.2.3 Decentralized search time increases by the number of edges
As provided by the results of experiments with parameters described in table 3.1, decentralized search is marginally faster when there is relatively small number of links in the graph, yet its time complexity quickly increases with the number of similarity edges (see figure 3.5. Dependency is plotted separately for graph with different agentNumber parameters, since number of vertices and number of edges in the graph are not independent variables – agentNumber is the parameter of simulation, but number of edges is an emergent variable. We use the number of similarity edges rather than total number of edges in the graph only for the reason that the number of similarity edges exceeds numbers of other types of edges by a few orders of magnitude and renders them ‘unimportant’.
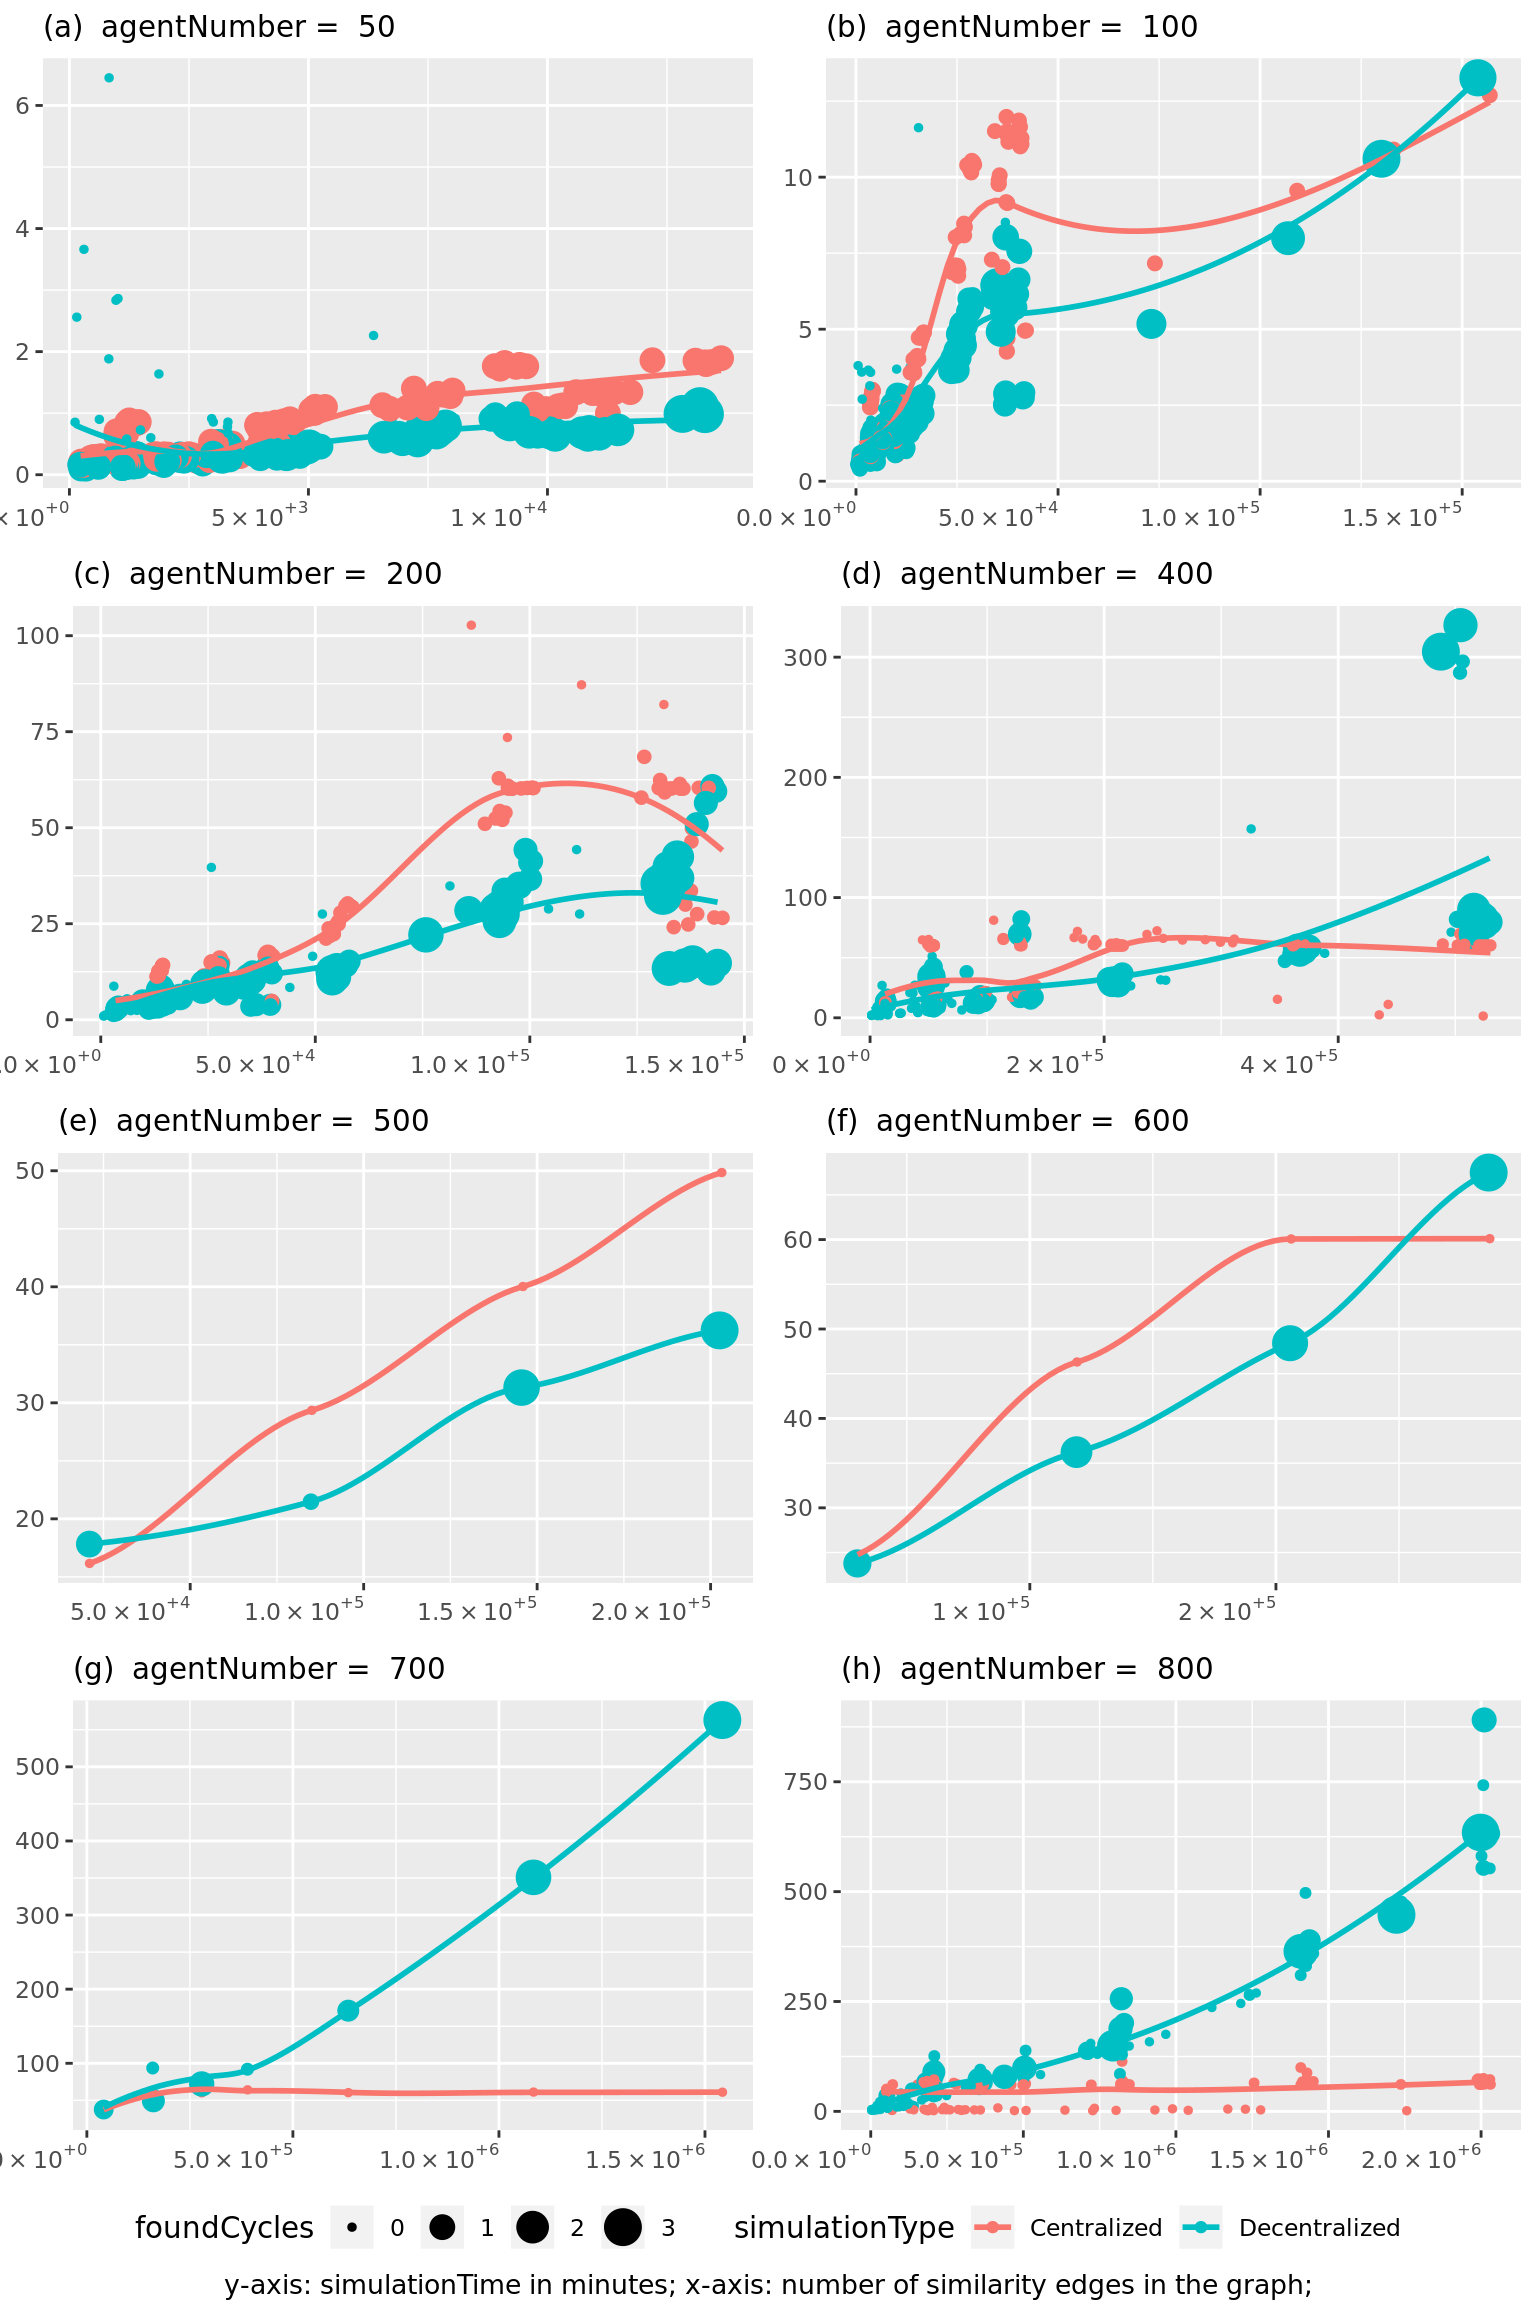
Figure 3.5: Dependence of simulation time on similarity edges in the graph as modulated by similarityConnectThreshold parameter for different agent numbers. Note, that centralized search is somewhat faster than decentralized which has to be investigated further.
3.2.4 Centralized search time increases by the number of vertices
Theoretically, centralized search time depends on the number of vertexes in the graph, due to the way centralized search works (see explanation). In practice it is somewhat problematic to estimate, since number number of edges is very much dependent from number of vertices in the graph and it is difficult to isolate the two – especially since number of edges is an emergent variable and not a parameter that can be manually set. Nevertheless, the dependency of simulation times on agentNumbers indicates that time increases with agentNumber.
![Time needed for centralized search roughly increases depending on number of item vertices in the graph: important parameters used for simulations displayed: agentNumbers=[50, 100, 200, 400,500,600,700,800]; Note, that in case of similarityConnectThreshold=0.9, there seems to be an anomaly, causes of which have to be investigated further.](02-experiment-1_files/figure-html/centralized-search-by-vertices-1.png)
Figure 3.6: Time needed for centralized search roughly increases depending on number of item vertices in the graph: important parameters used for simulations displayed: agentNumbers=[50, 100, 200, 400,500,600,700,800]; Note, that in case of similarityConnectThreshold=0.9, there seems to be an anomaly, causes of which have to be investigated further.
3.3 Insights and future steps
Based on the results of experiments and above discussion we can confidently make the following considerations in order to guide further design of the software framework:
- First, centralized search is not feasible for graphs with large number of nodes. This is not very surprising as it is known that many graph algorithms tend to behave exponentially. Note, that even in case of “moderate” exponential behaviour it is not acceptable for us, since the goal of the Offer Networks architecture (and open-ended decentralized computing framework in general) is to conceive conceptual and computational model able to achieve practical solutions on very large graph data structures – with at least millions of vertices and tens of millions of edges. Smaller graphs, while may be useful for academic research purposes, do not sound interesting enough for devising a computational model of alternative economy.
- Second, decentralization is sought as a conceptual remedy for intractability of centralized algorithms when run on very large (and dynamic) data structures. As explained above, decentralization comes at a cost of increased aggregated computational complexity and loss of optimality but in principle enables to achieve asymptotic results in practically acceptable time frames. While decentralized search algorithms of OfferNet(s) do not perform very well when running on (1) graph structures with large diameters of \(agent \xrightarrow{\text{knows}} agent\) subgraphs and (2) graphs with large amount of similarity links between items, decentralization provides possibilities of optimizations, which are not available in centralized computation;
- Decentralized search can be greatly improved by following optimizations to be explored by Experiment #2:
- smartly constructing traversals which dynamically prune search tree based on certain criteria, which could be individual for each agent. In OfferNet(s) model such criteria could be the degree of
similarityamongitems; - controlling topology of the graph by connecting
itemsof the graph into \(item \xrightarrow{\text{similarity}} item\) subgraph with bounded diameter and then running search processes #4 along with processes #1.
- smartly constructing traversals which dynamically prune search tree based on certain criteria, which could be individual for each agent. In OfferNet(s) model such criteria could be the degree of
- Last, but not least, as demonstrated by running times on graphs with large number of edges (see figure 3.5) large scale simulations are needed to reveal certain non-linear behaviours that cannot be extrapolated from small scale simulations alone (i.e. the observation that time needed for decentralized search exceeds centralized search only when number of edges is roughly above one million).
References
Turchin, Valentin F. 1986. “The Concept of a Supercompiler.” ACM Transactions on Programming Languages and Systems 8: 292–325.
Pennachin, Cassio, Ben Goertzel, and Neil Geisweiller. 2014. I. Engineering General Intelligence, Part 1: A Path to Advanced AGI via Embodied Learning and Cognitive Synergy. 2014 edition. New York: Atlantis Press.
Laud, Peeter. 2011. “Complexity Theory (MTAT.07.004), Lecture 2.” http://kodu.ut.ee/~fs191/complexity/Lecture2.pdf.